Helsinki Tram MLOps
Live tram tracking and 5-minute delay forecasts for every tram in Helsinki.
- forecast error (MAE) vs 64.7 s for the naive baseline
- 35.2 s
- forecast error (MAE) vs 64.7 s for the naive baseline
- trams tracked live, refreshed every 15 s
- ~100
- trams tracked live, refreshed every 15 s
- rows in the out-of-sample backtest
- 1.08 M
- rows in the out-of-sample backtest
Overview
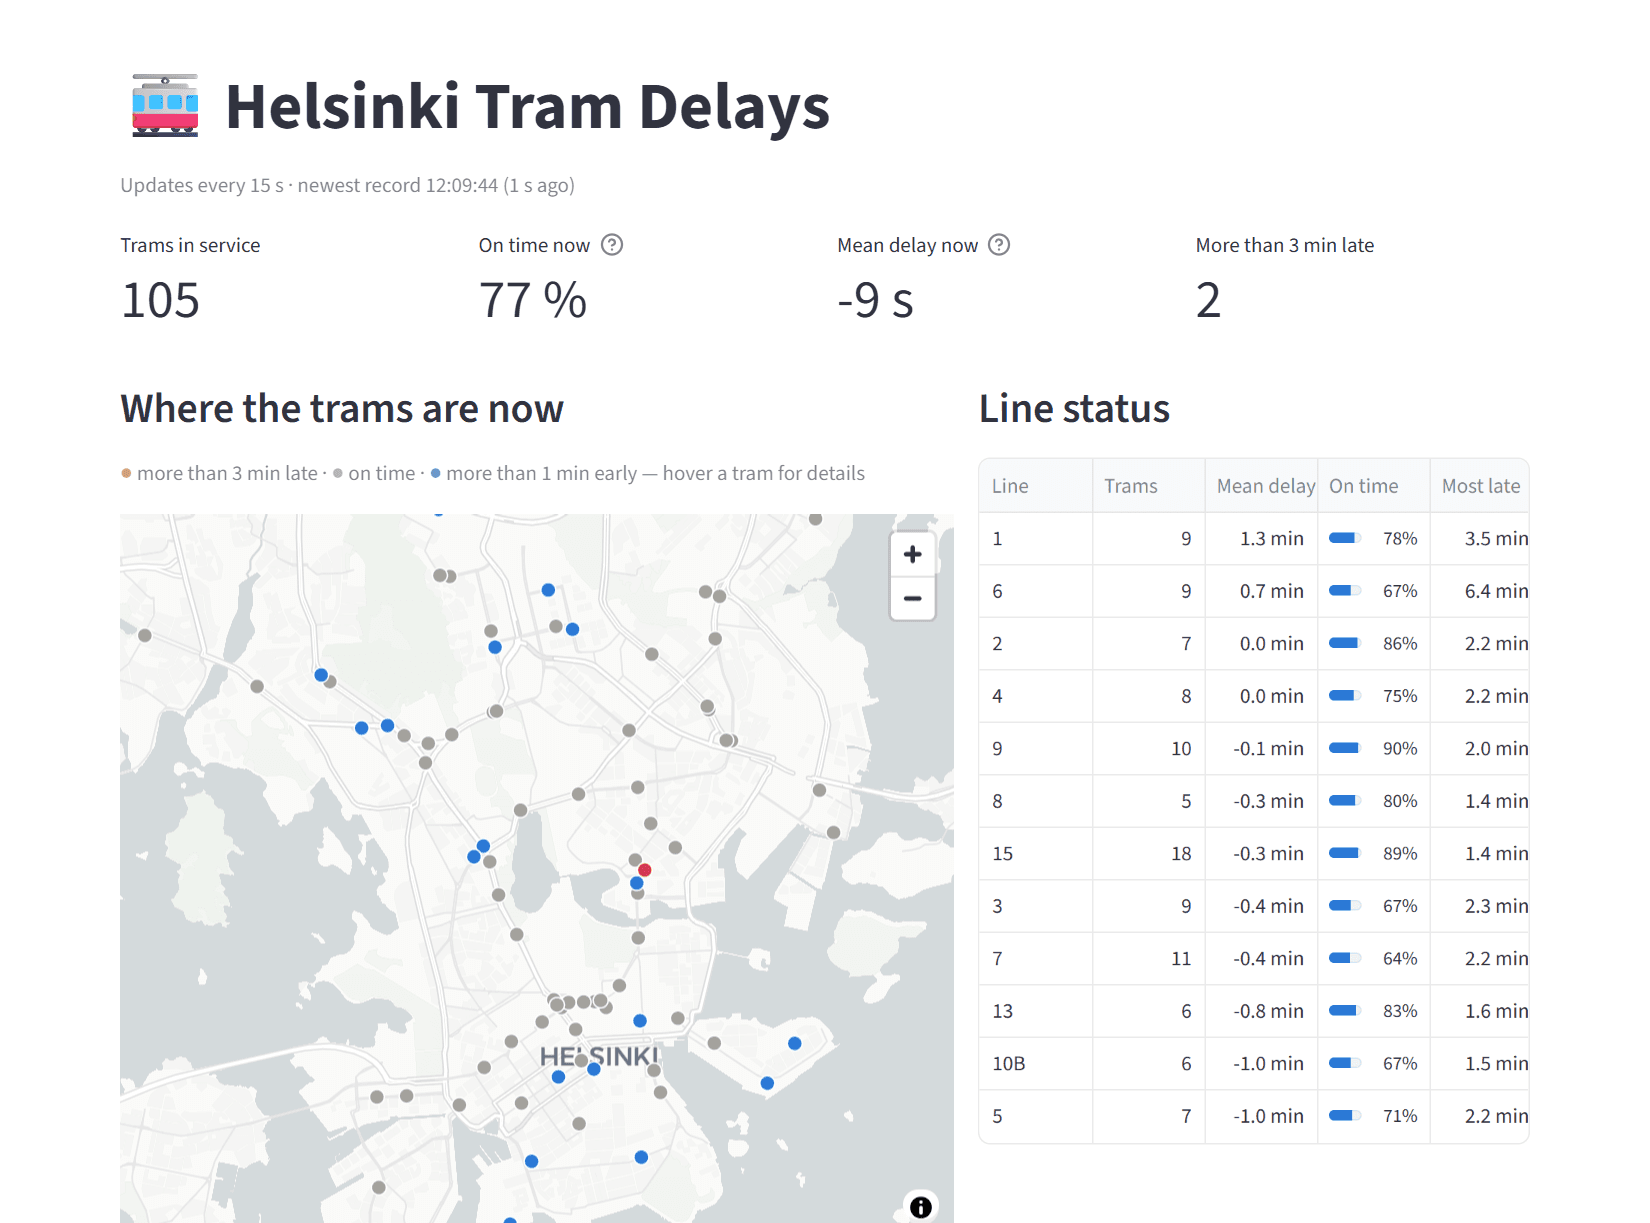
An end-to-end pipeline on real data: it streams GPS positions of all Helsinki trams from HSL's public feed, cleans them into a daily dataset, trains a model that forecasts each tram's delay five minutes ahead, and shows everything in a live dashboard that runs around the clock on a cloud VM.
How it works
- Ingest: subscribes to HSL's high-frequency positioning feed over MQTT (about 100 messages per second) and keeps one position per tram every 10 seconds.
- Process: deduplicates, fixes data issues and writes one Parquet partition per day.
- Train: builds features, splits by time, trains gradient boosting and saves a versioned model with its metrics.
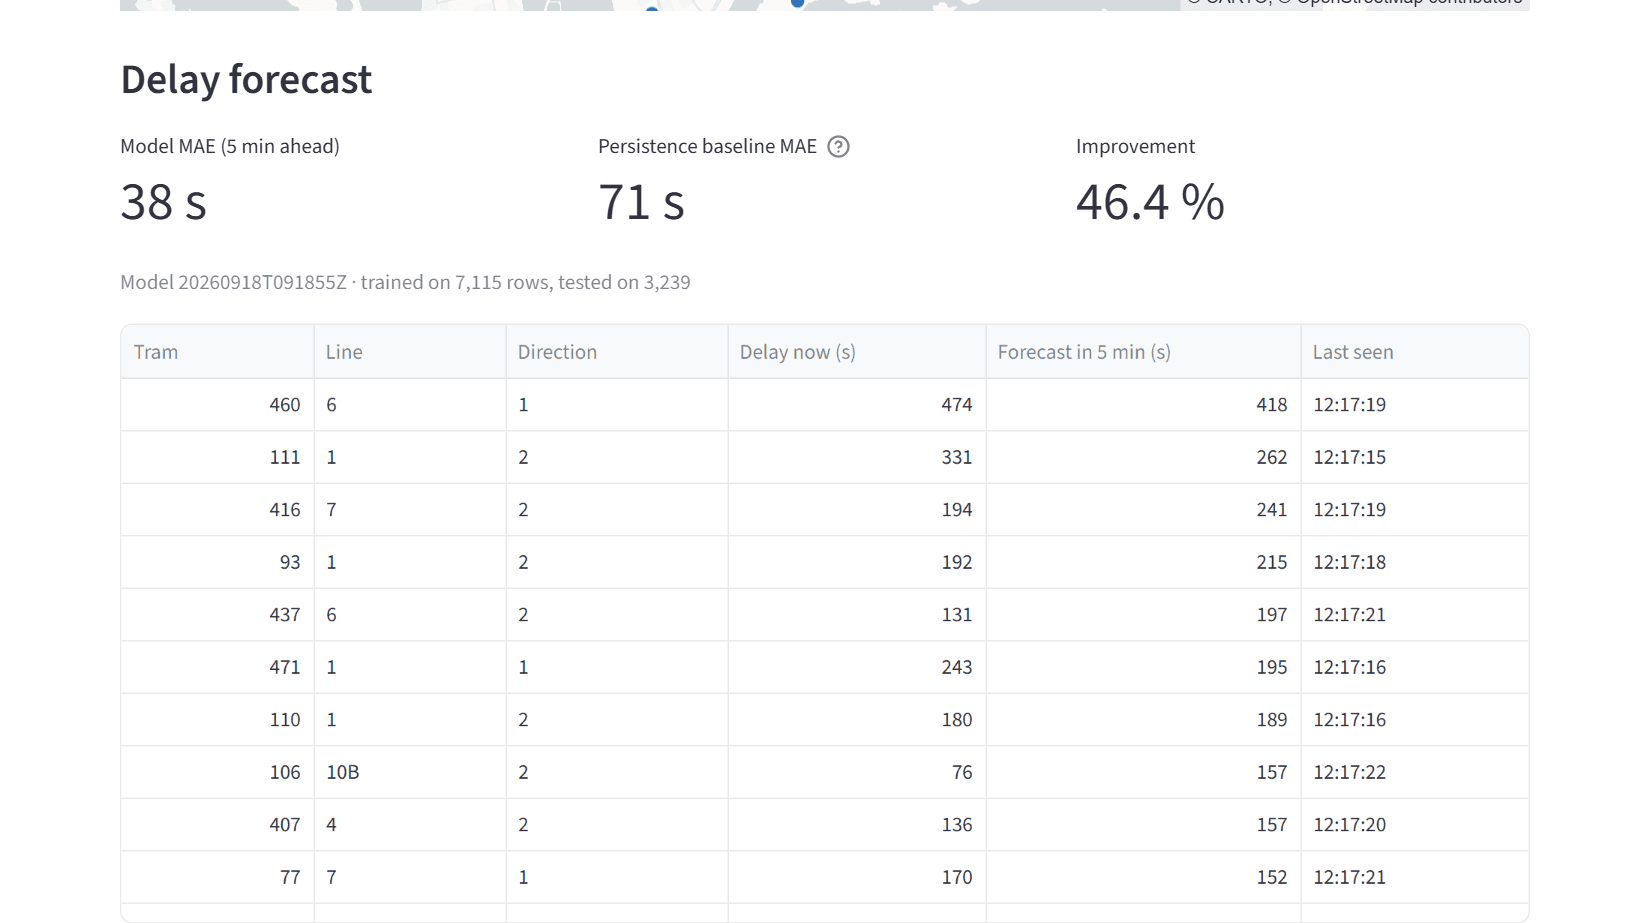
- Serve: a Streamlit dashboard with live, history, model-health and system pages. It also has an Ask page where an LLM answers questions using read-only lookups over the data.
Evaluation
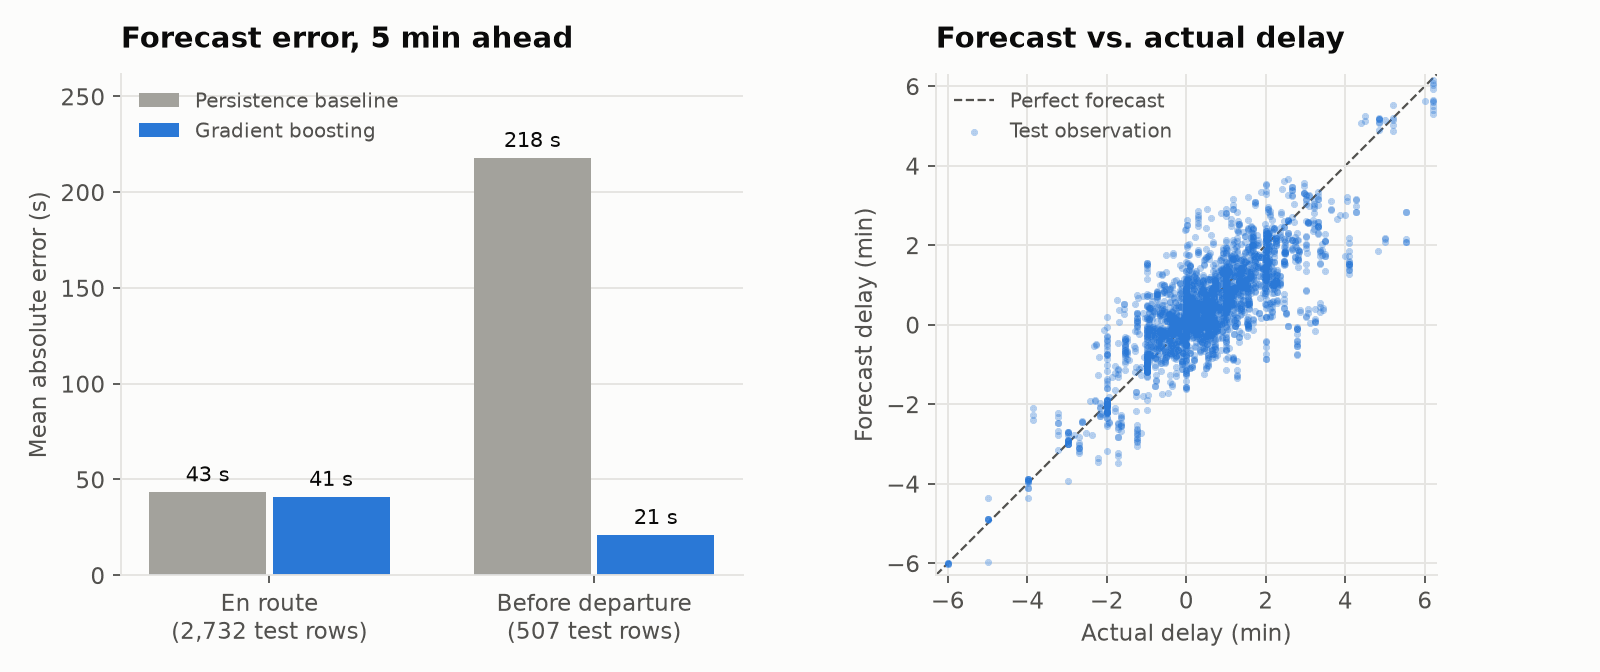
The model is compared with a persistence baseline ("the delay stays as it is") in a rolling-origin backtest: each day is predicted by a model trained only on earlier days, and training rows whose target would leak into the test day are removed. Without that purge, an early run overstated the improvement (45% instead of 32%).
Across all observations the model's error is 35.2 s against 64.7 s for persistence. Most of that gain comes from trams waiting at the terminus. For trams already en route, the improvement is smaller but consistent: 5.8 s, with a 95% bootstrap interval of 5.7–6.0 s.
Data problems found in the raw feed
- The delay field is positive when a tram is ahead of schedule, so the sign had to be flipped.
- Some trams stay signed into a journey hours after it ends, which looks like a 2-hour delay. In the first live run, these rows pushed the mean delay to +237 s instead of −3 s.
- The broker sometimes delivers the same message twice.
- Timestamps are UTC, which shifted the hour-of-day charts by 2–3 hours.
Screens
Related projects
23.5 M
invoice rows, 2016–2026 (€98.8 bn)
Public Procurement Intelligence (BPIL)
Turning ten years of Finnish public spending data into evidence-backed buyer intelligence.
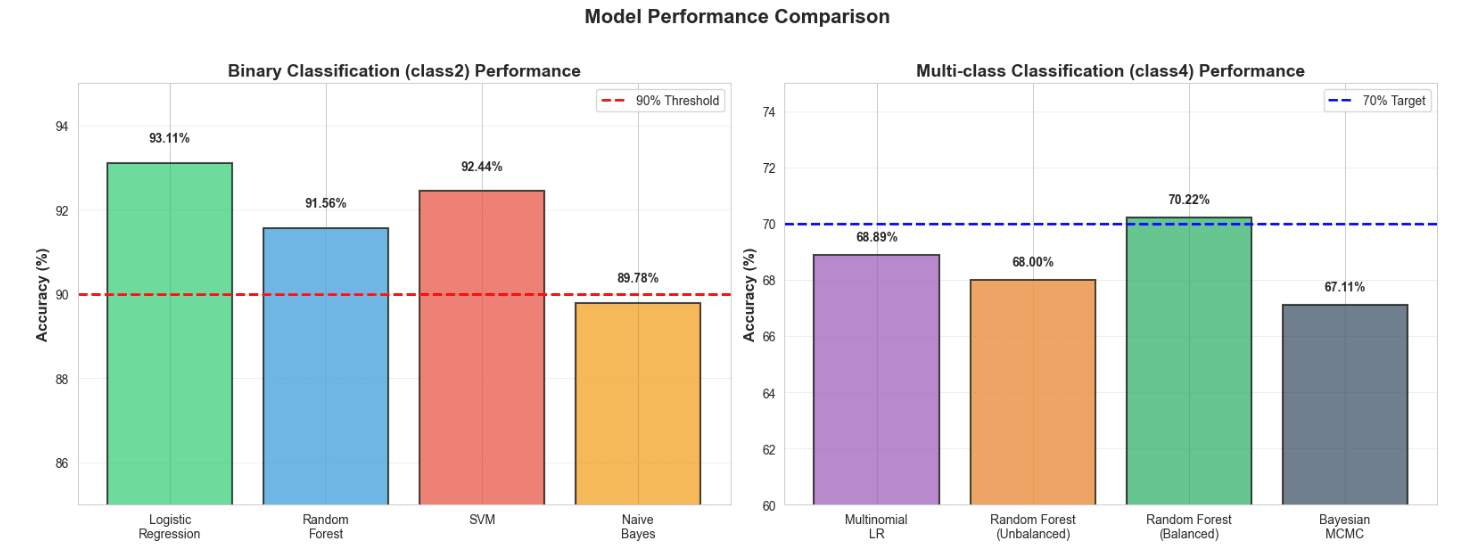
New Particle Formation Classification
5th out of 149 teams in the University of Helsinki ML course competition.